

Raven
Whether an app is up, how each action behaves, and where a slow call spent its time.
Web and desktop app · runs for a company or on one Mac
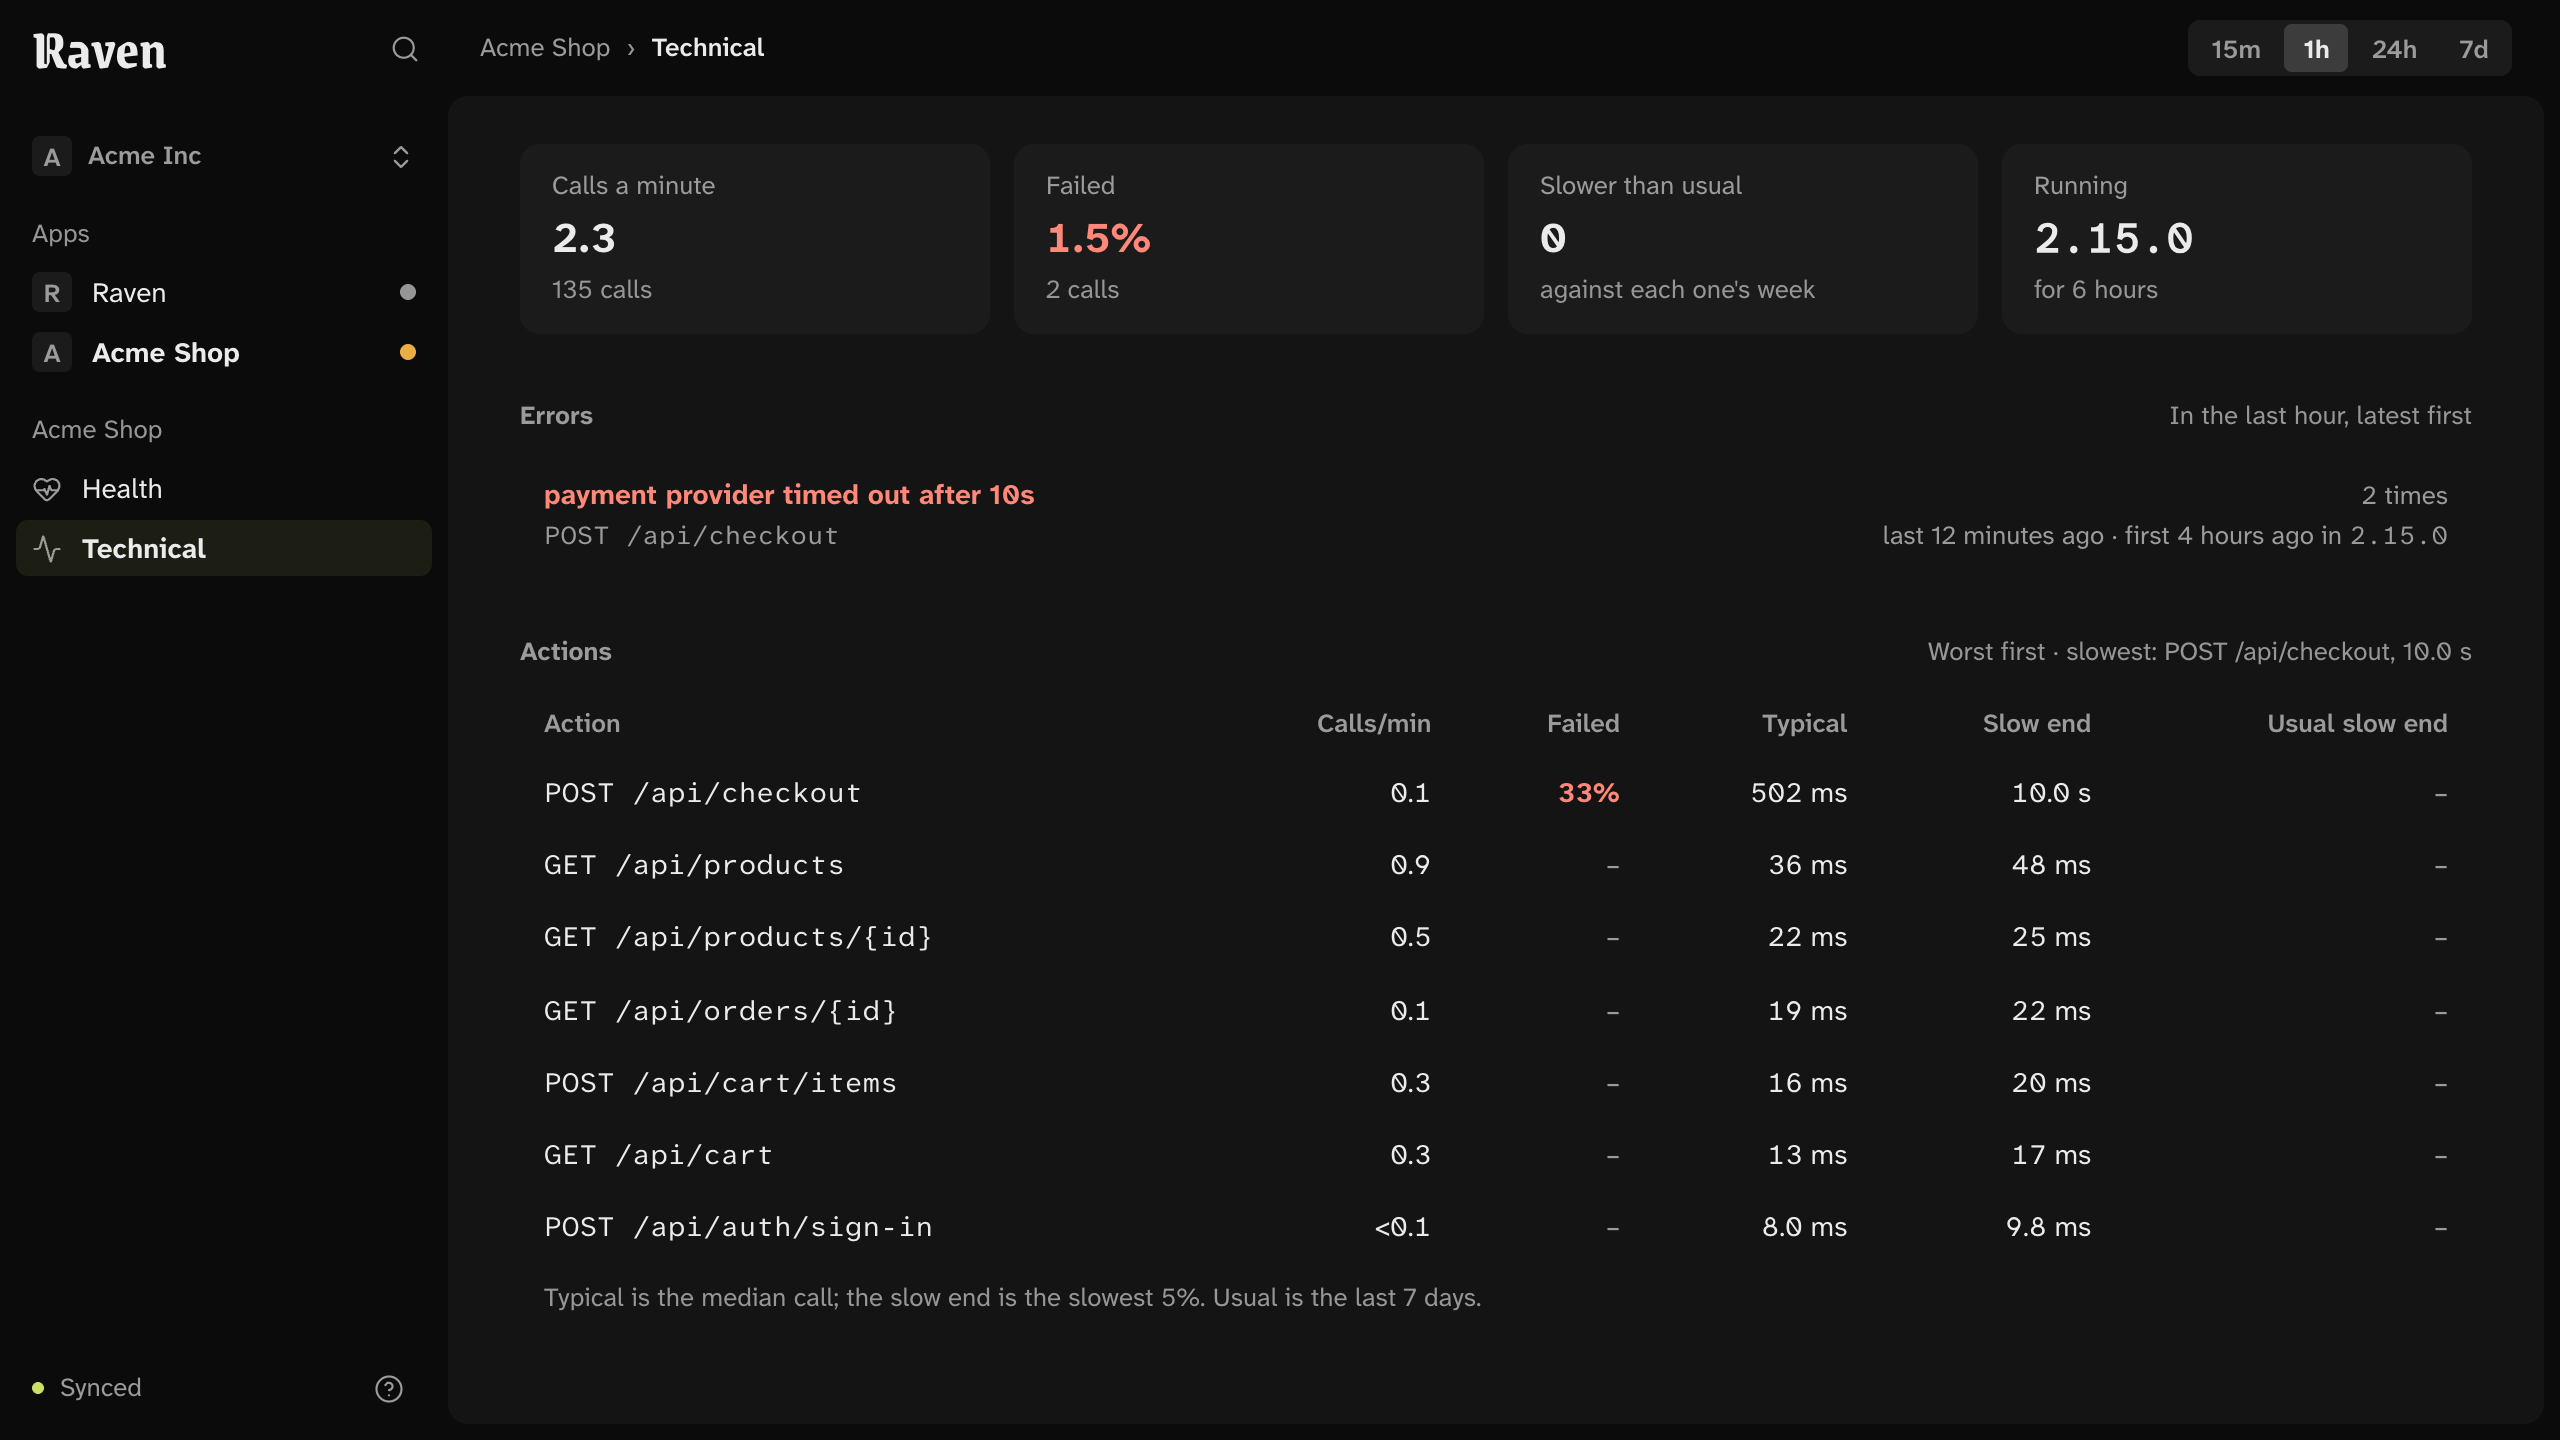
Every action, worst first.
Calls a minute, failures, and typical and slow-end times against each action’s own week. Errors grouped, with the version they started in.
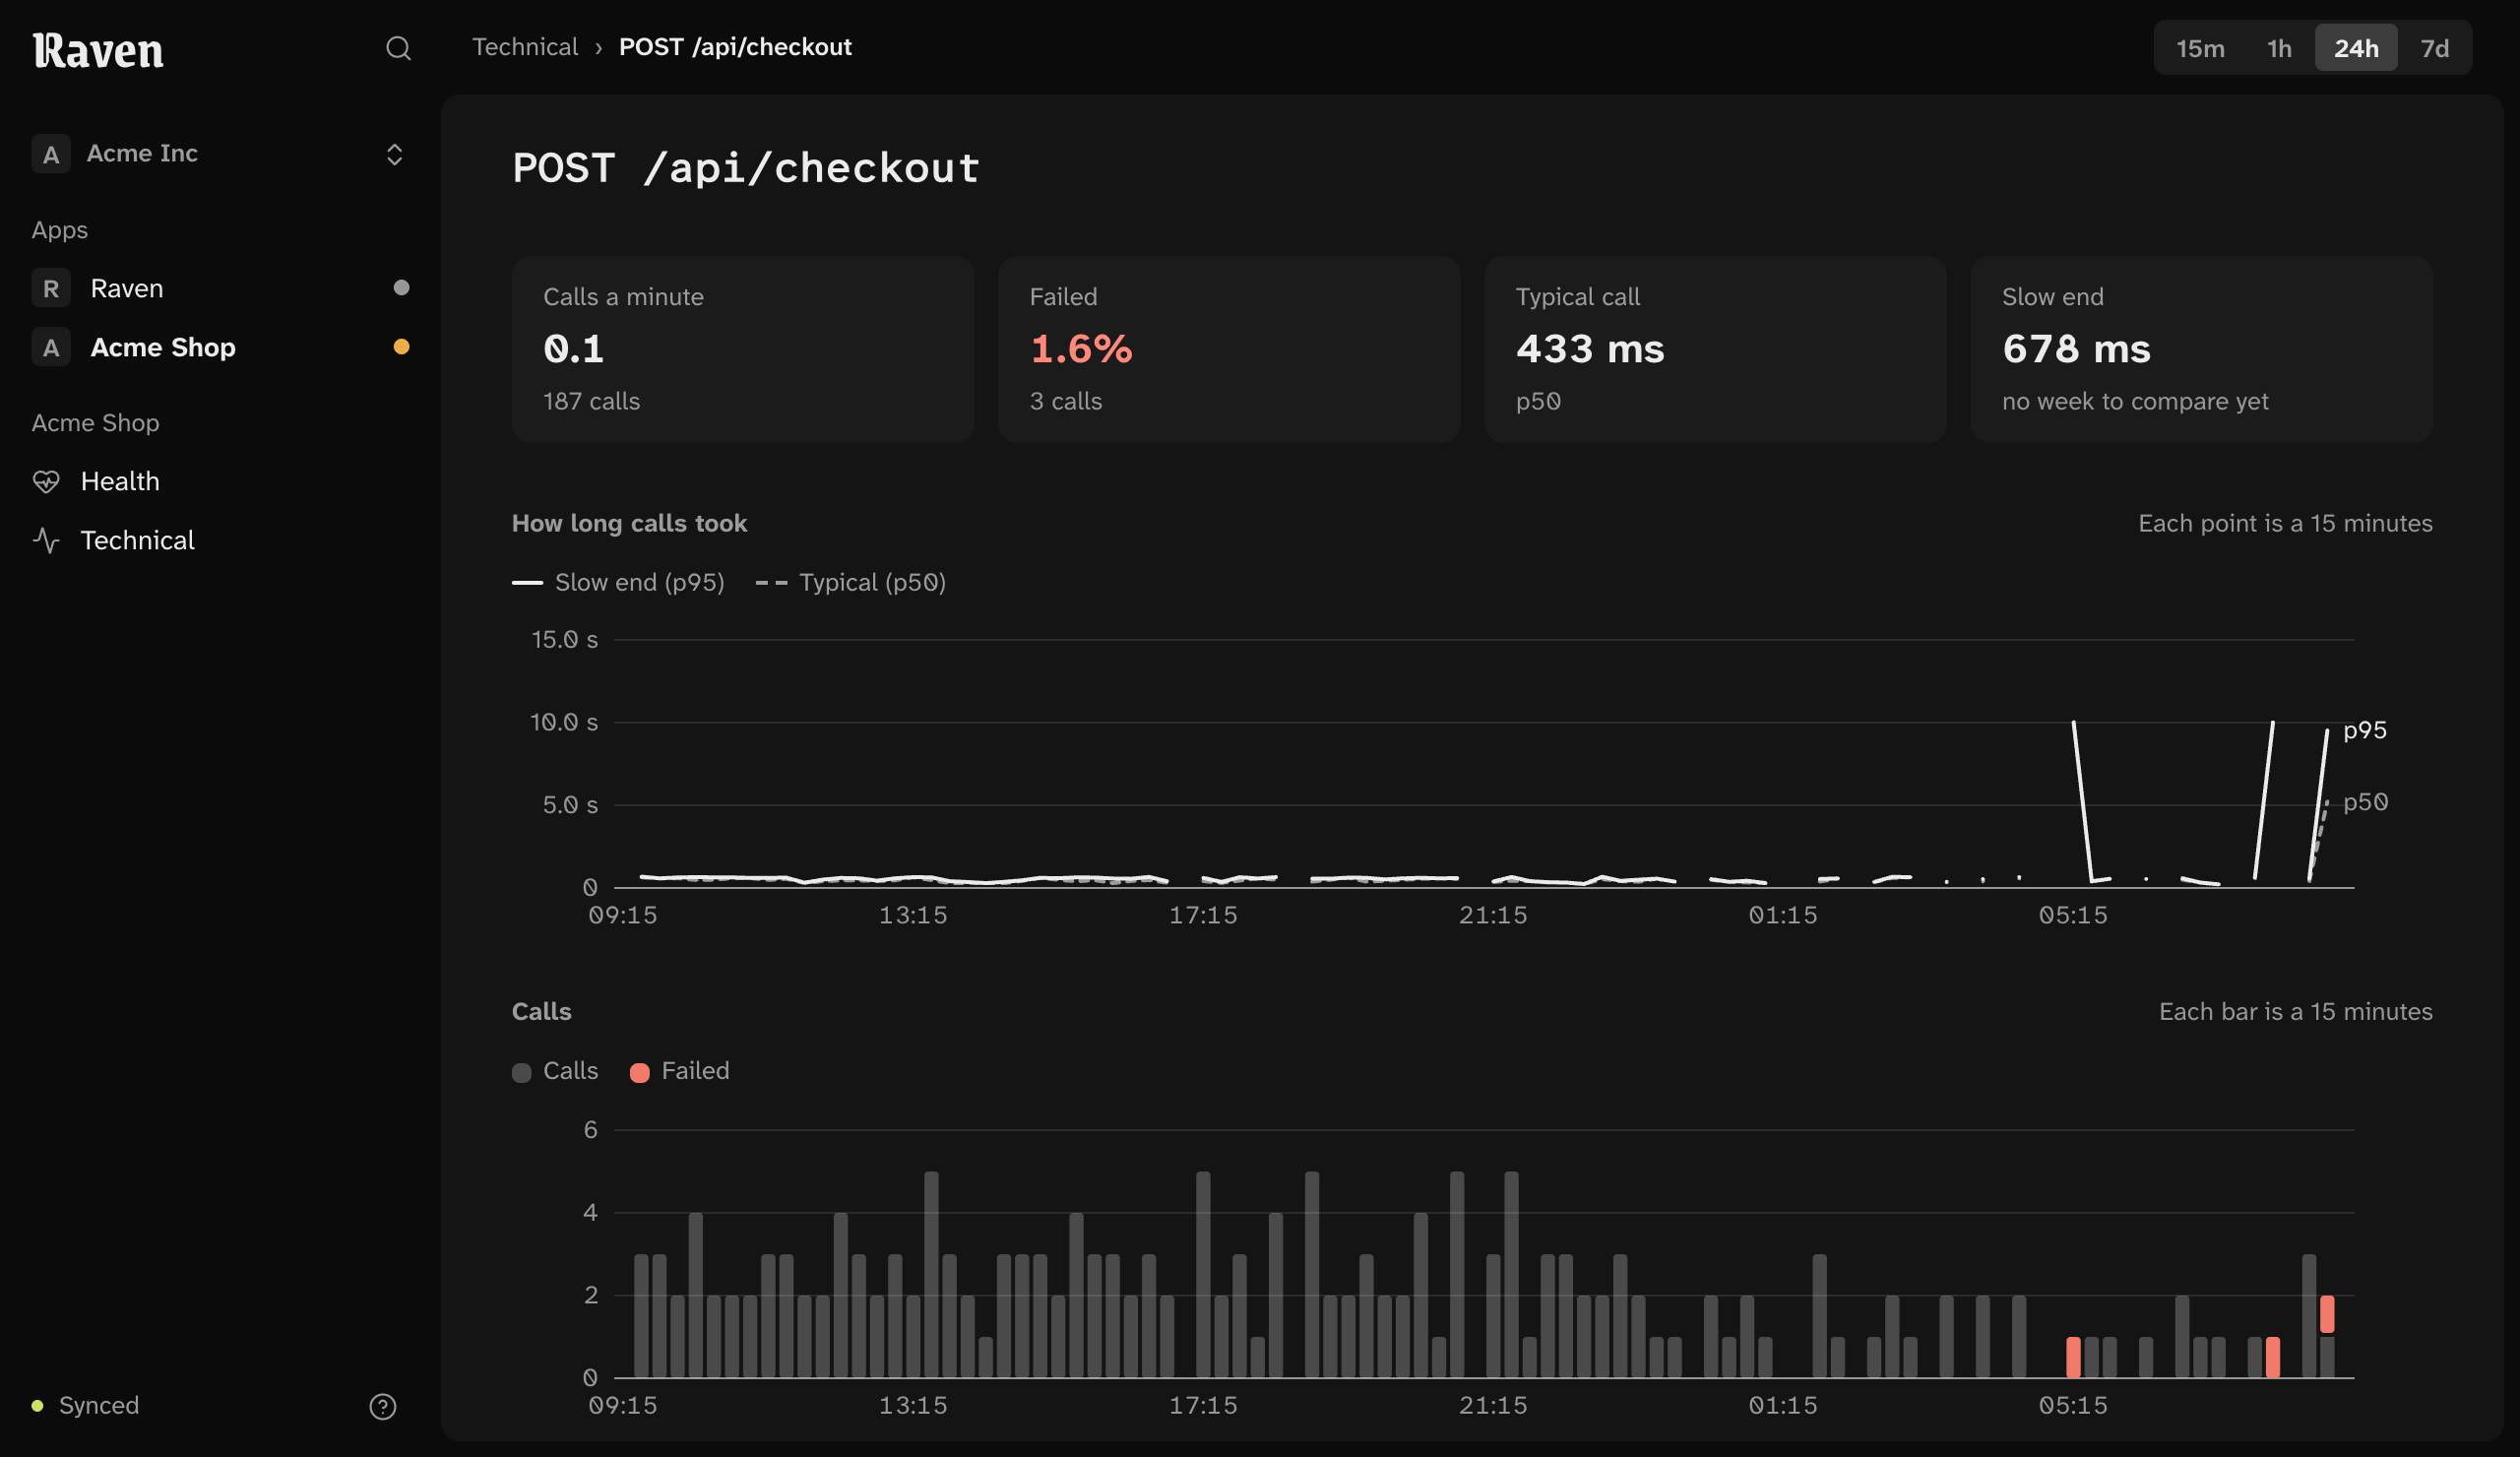
One action over time.
How long its calls took and how many failed, minute by minute or across a week, and its slowest calls to open.
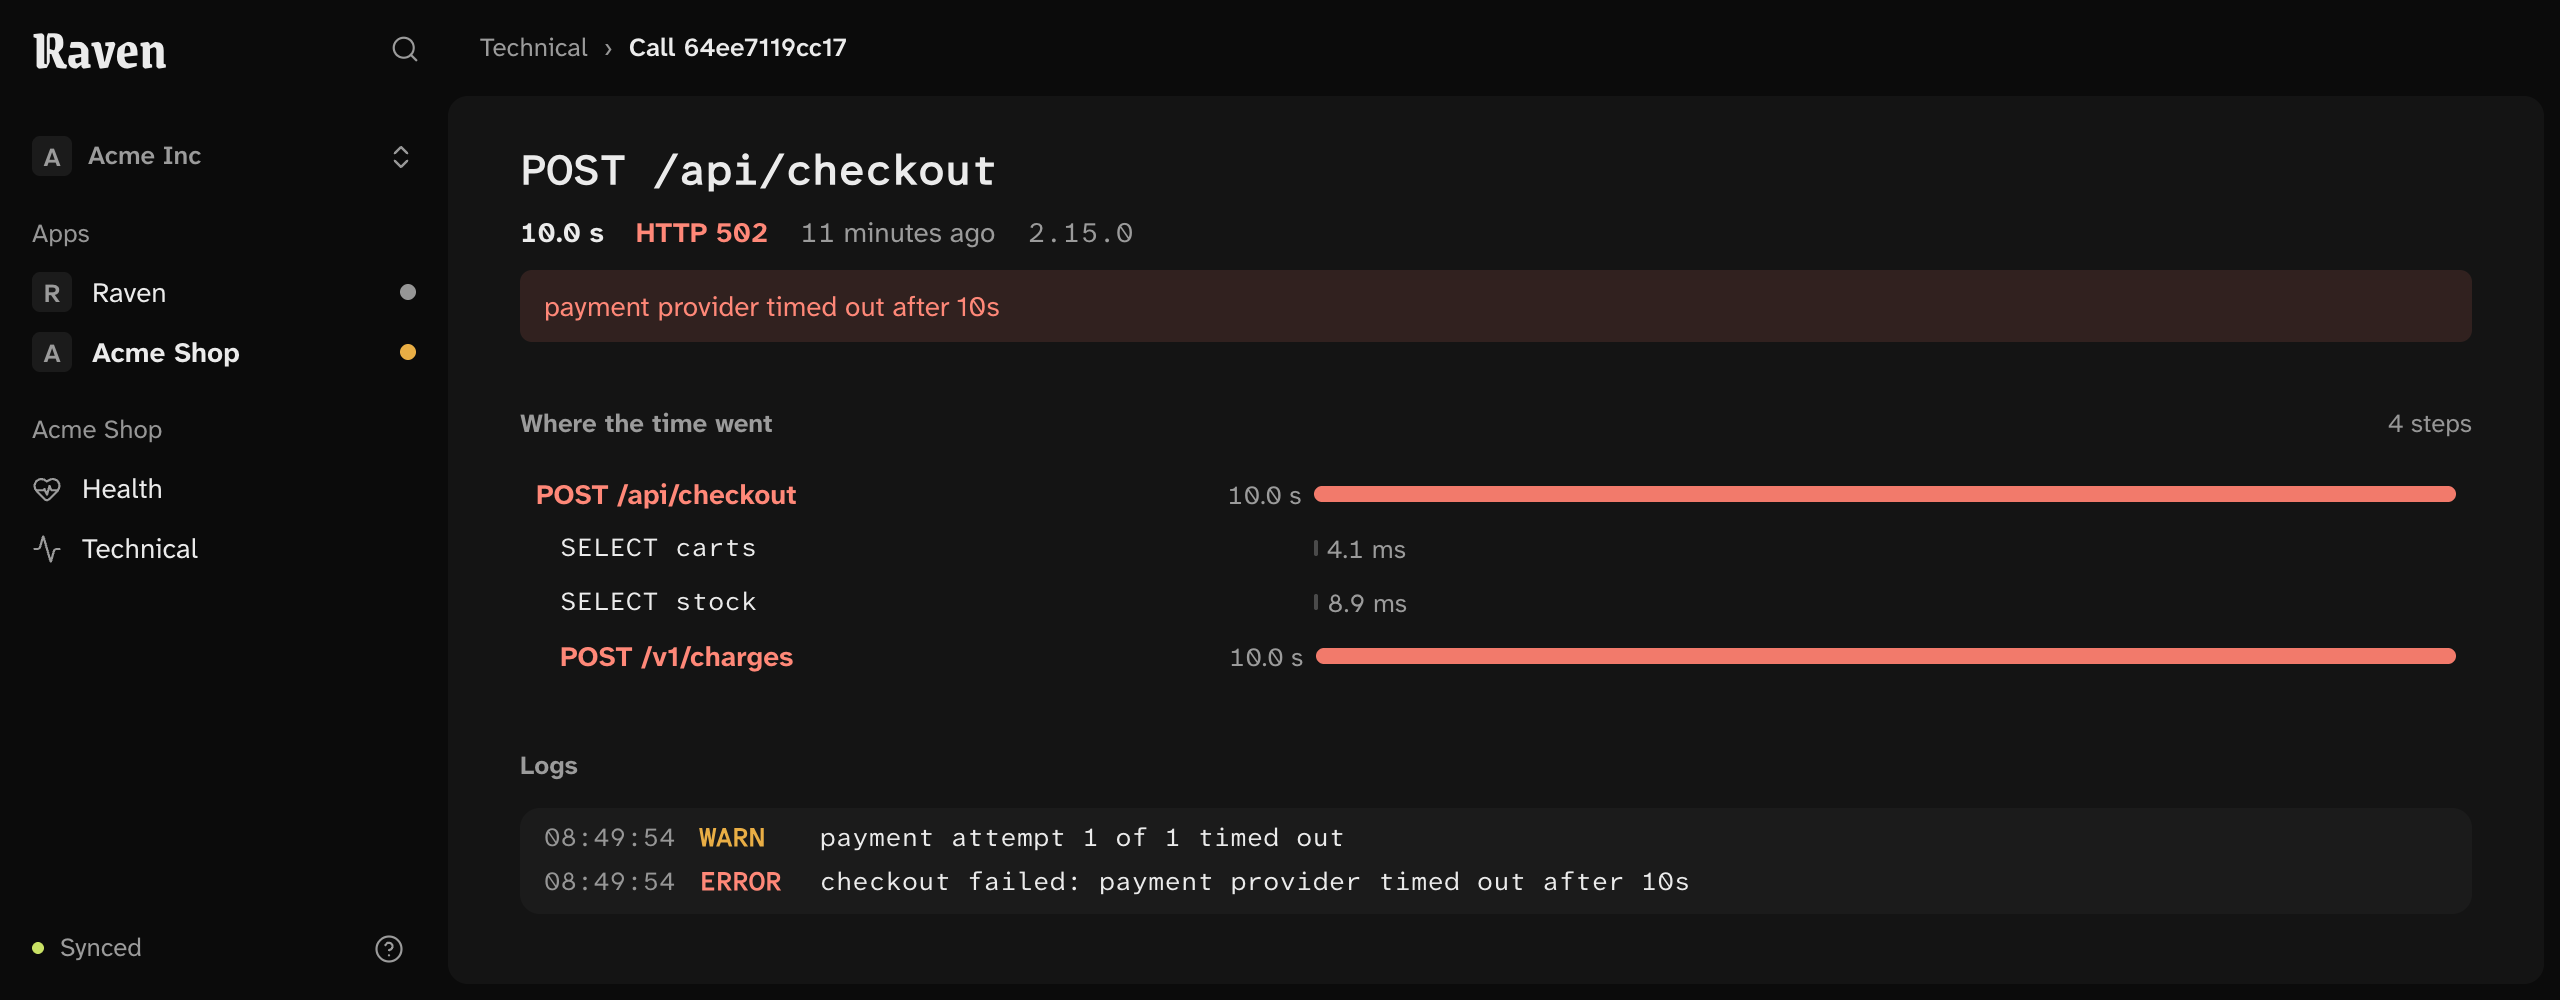
One call, step by step.
Where its time went, down to each database query and outside call, with the logs it wrote.
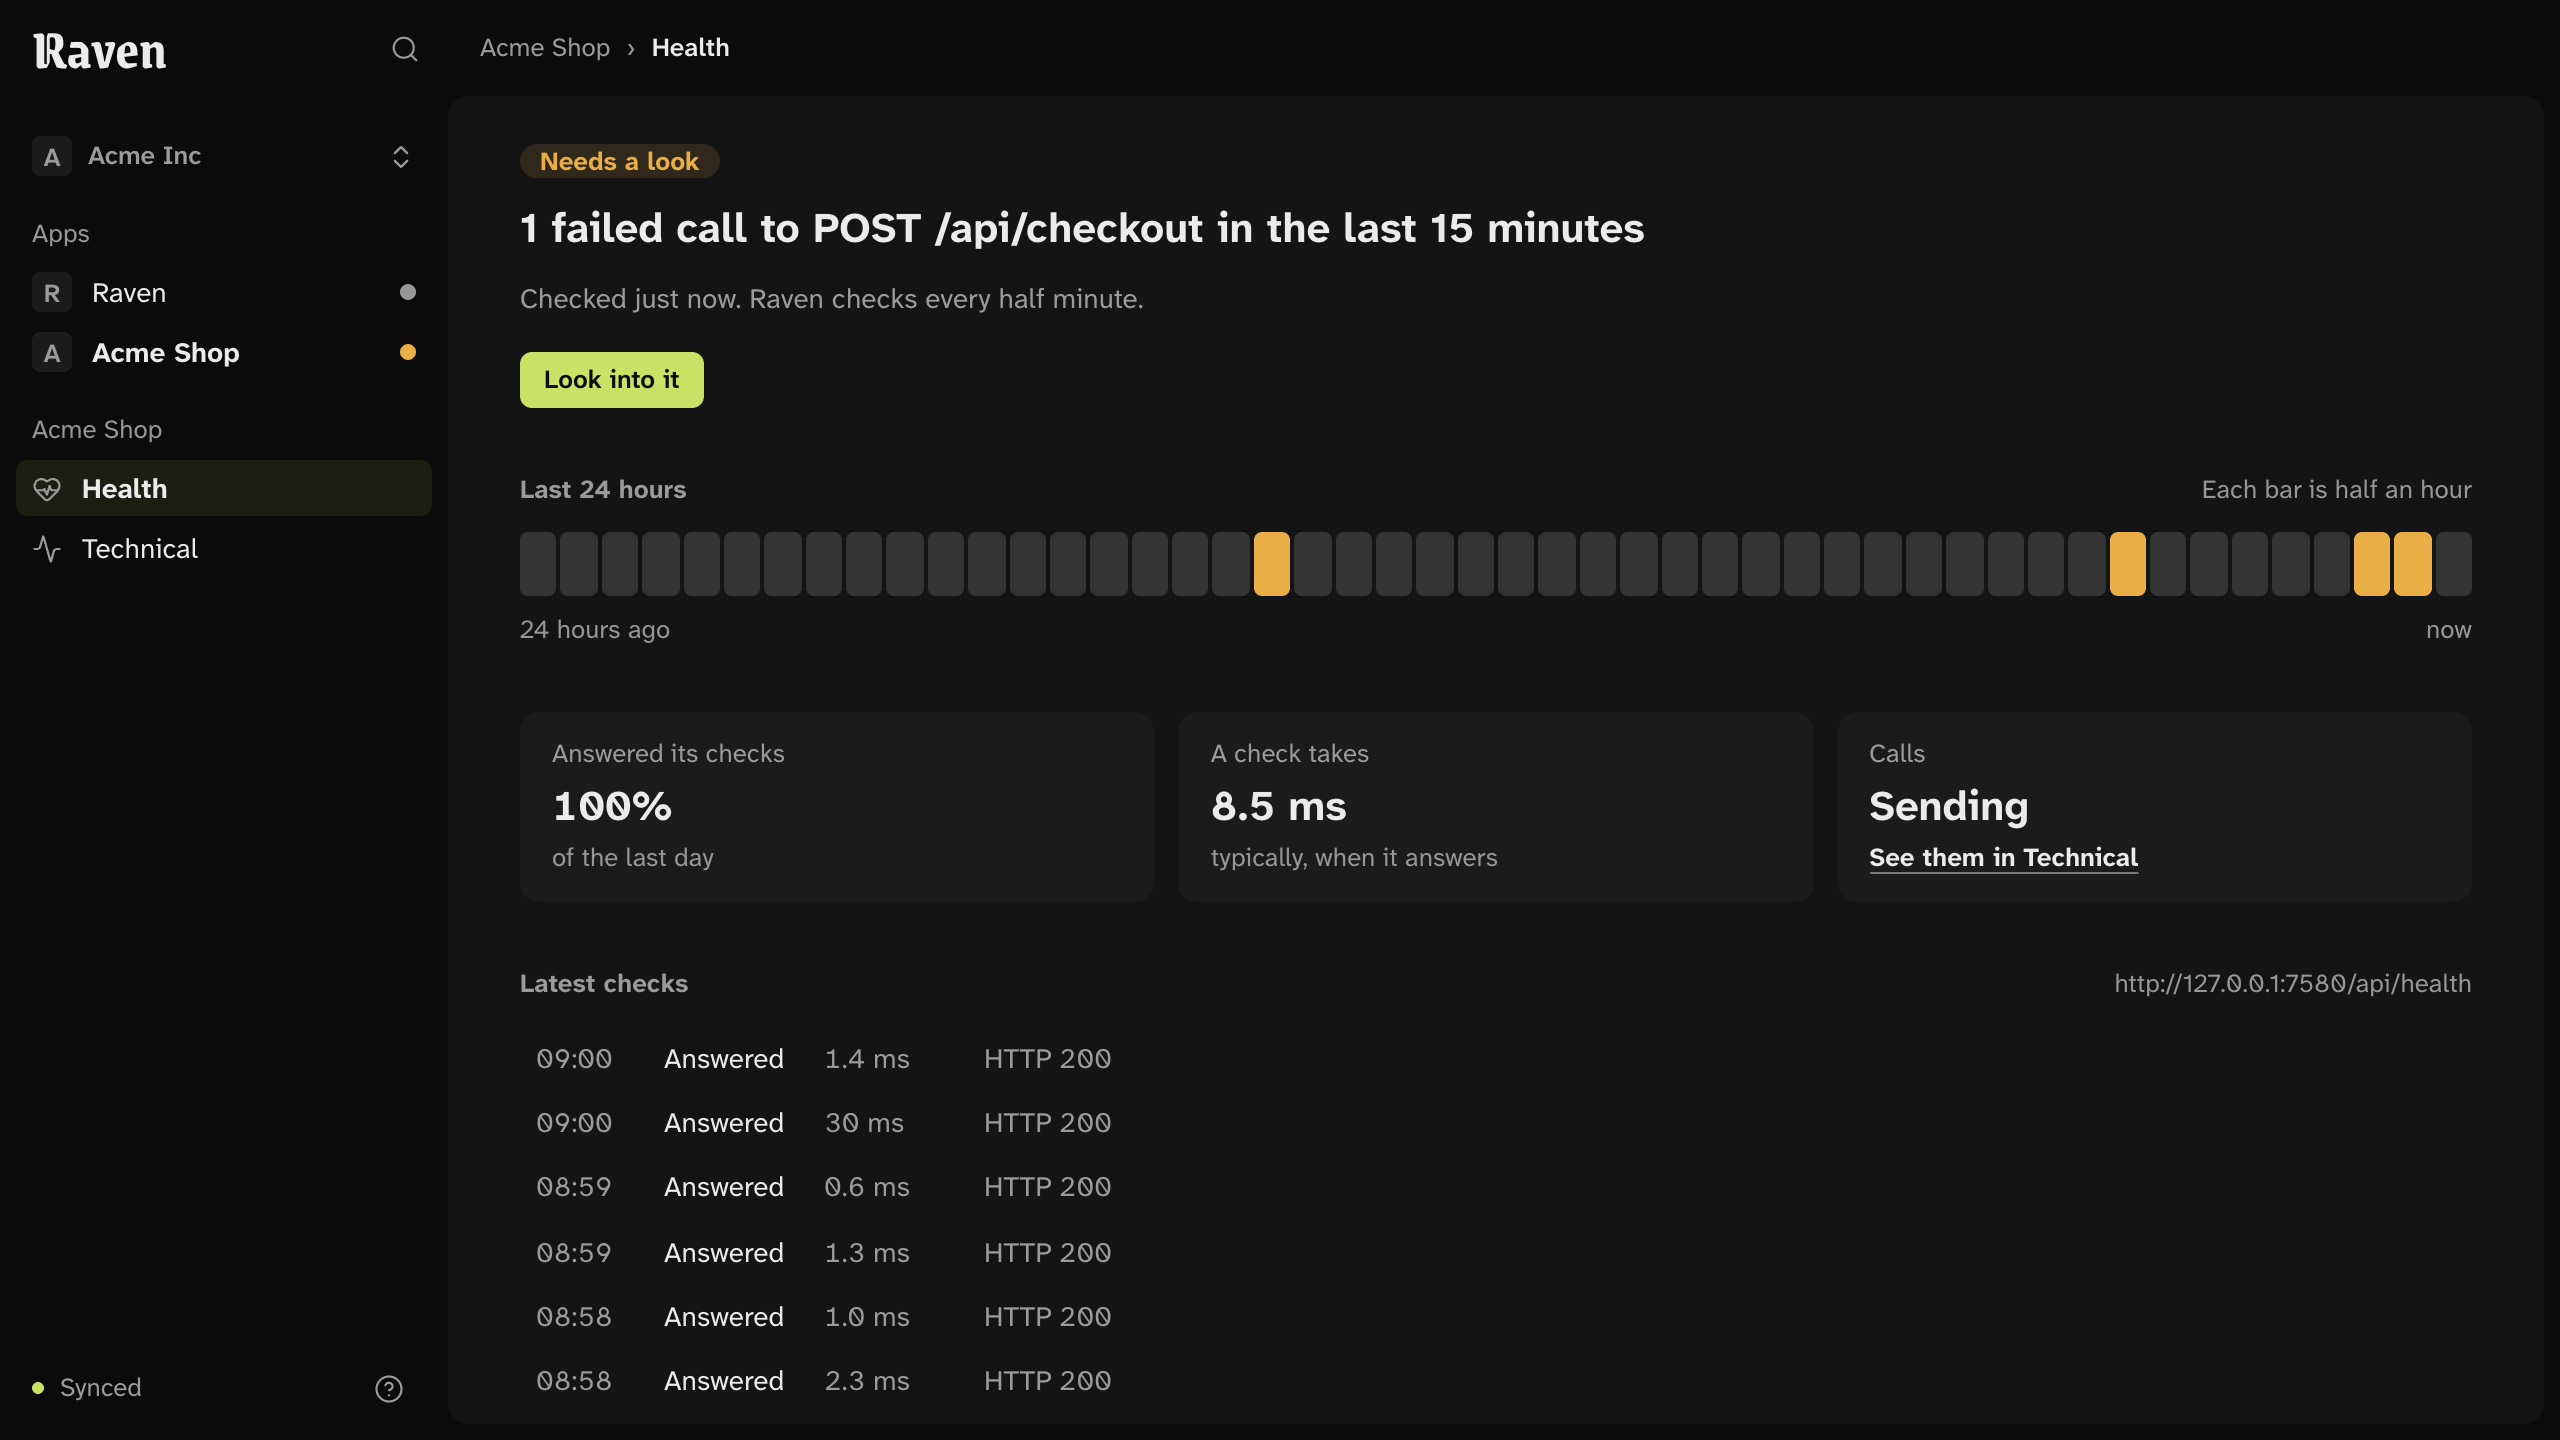
- Health checks. Raven asks each app’s health address every half minute: up, needs a look, or down, in one sentence.
- OpenTelemetry in. Apps send traces and logs over HTTP with a key.